The Blue Line Is Going Down
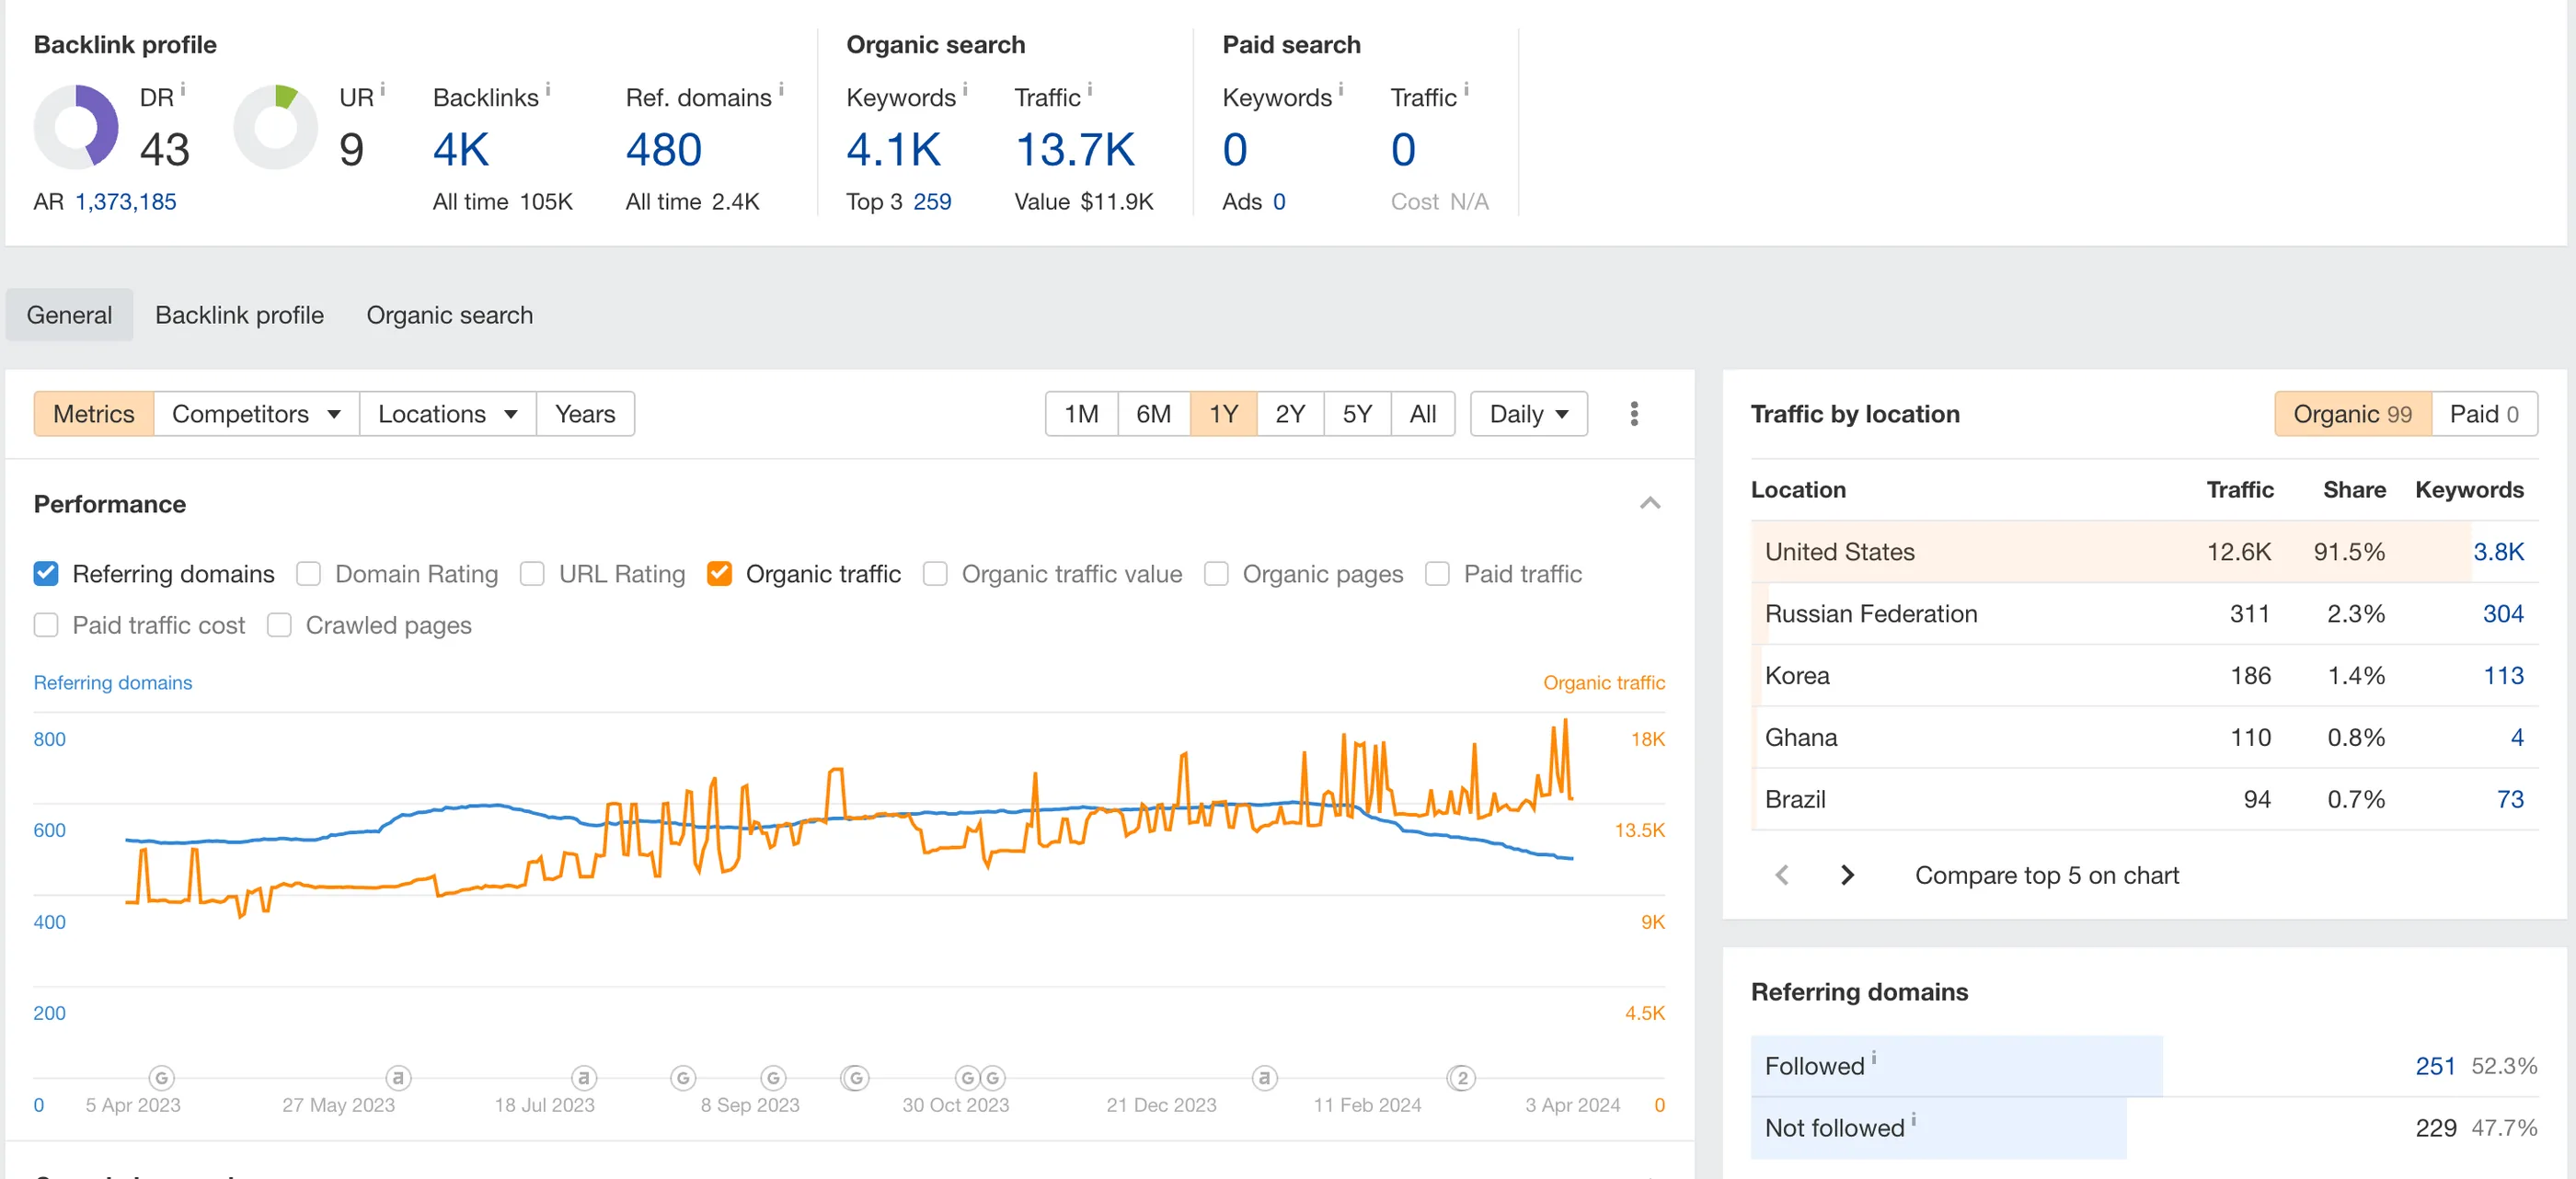
On every other chart here the referring domain count climbs or holds. On this one it turns over in the final quarter and falls, and that is worth more attention than the traffic.
Organic traffic
13.7K
sessions a month, Ahrefs estimate
Traffic value
$11.9K
to buy the same as ads, monthly
- Terms in the top three
- 259
- Keywords ranking
- 4.1K
- Domain Rating
- 43
- Referring domains
- 480
One year to April 2024. WordPress.
- United States 91.5%
- Russian Federation 2.3%
Reading the panel
The site records 13,700 organic sessions a month from 4,100 ranking keywords, of which 259 sit in the top three. It carries 480 referring domains and 4,000 backlinks for a Domain Rating of 43, with traffic valued at $11,900 a month.
Ahrefs captured this across the year to April 2024.
Link decay, which nobody prices
Links are not permanent. Sites close, pages get pruned, editors rewrite old articles and drop outbound references, and directories go out of business. A profile that is not being added to shrinks on its own.
The visible drop here runs from roughly February, and the referring domain count ends the window below where it stood in December. For most of the year the line was climbing, so this is not a site that never built links. It is a site that stopped, and the natural attrition became visible once nothing was replacing it.
It also has the noisiest traffic line in this set outside the cleaning project, spiking and dropping repeatedly rather than trending. Combined with the falling domain count, that is a profile with no momentum behind it.
Modestly up is still up
Traffic ends the year somewhat higher than it started, which should be said plainly rather than buried under the criticism above. On a twelve month view this is a positive result.
It is included here because an unremarkable chart is more representative of ordinary search work than the four times and sevenfold ones, and because the falling link count is a specific, diagnosable thing that a portfolio of wins would never show you.
What the panel cannot show
Whether the engagement was still running through the final quarter. A profile that decays after the work ends is expected, not a failure, and the chart cannot tell you which side of that line the last three months fall on.
Traffic is 91.5% United States. Parking search behaviour depends almost entirely on local density and app penetration, neither of which is comparable between a large American city and Doha.
What to do if your chart looks like this
Ask for referring domains gained against referring domains lost, not the net figure. Most reports show the total, which hides attrition entirely and can show a flat line while a third of the profile turns over underneath it.
That distinction is one of the questions on the choosing an agency page, and the realistic view of what is available to build in Qatar is on the SEO services page.