The One That Went Backwards
Every other chart on this site ends at or near its high point. This one peaked in September 2023 and has been sliding since.
Organic traffic
25.1K
sessions a month, Ahrefs estimate
Traffic value
$5.4K
to buy the same as ads, monthly
- Terms in the top three
- 704
- Keywords ranking
- 25.1K
- Domain Rating
- 40
- Referring domains
- 830
Two years to April 2024. WordPress.
- United States 68.4%
- United Kingdom 8.5%
- India 7.3%
What the panel shows
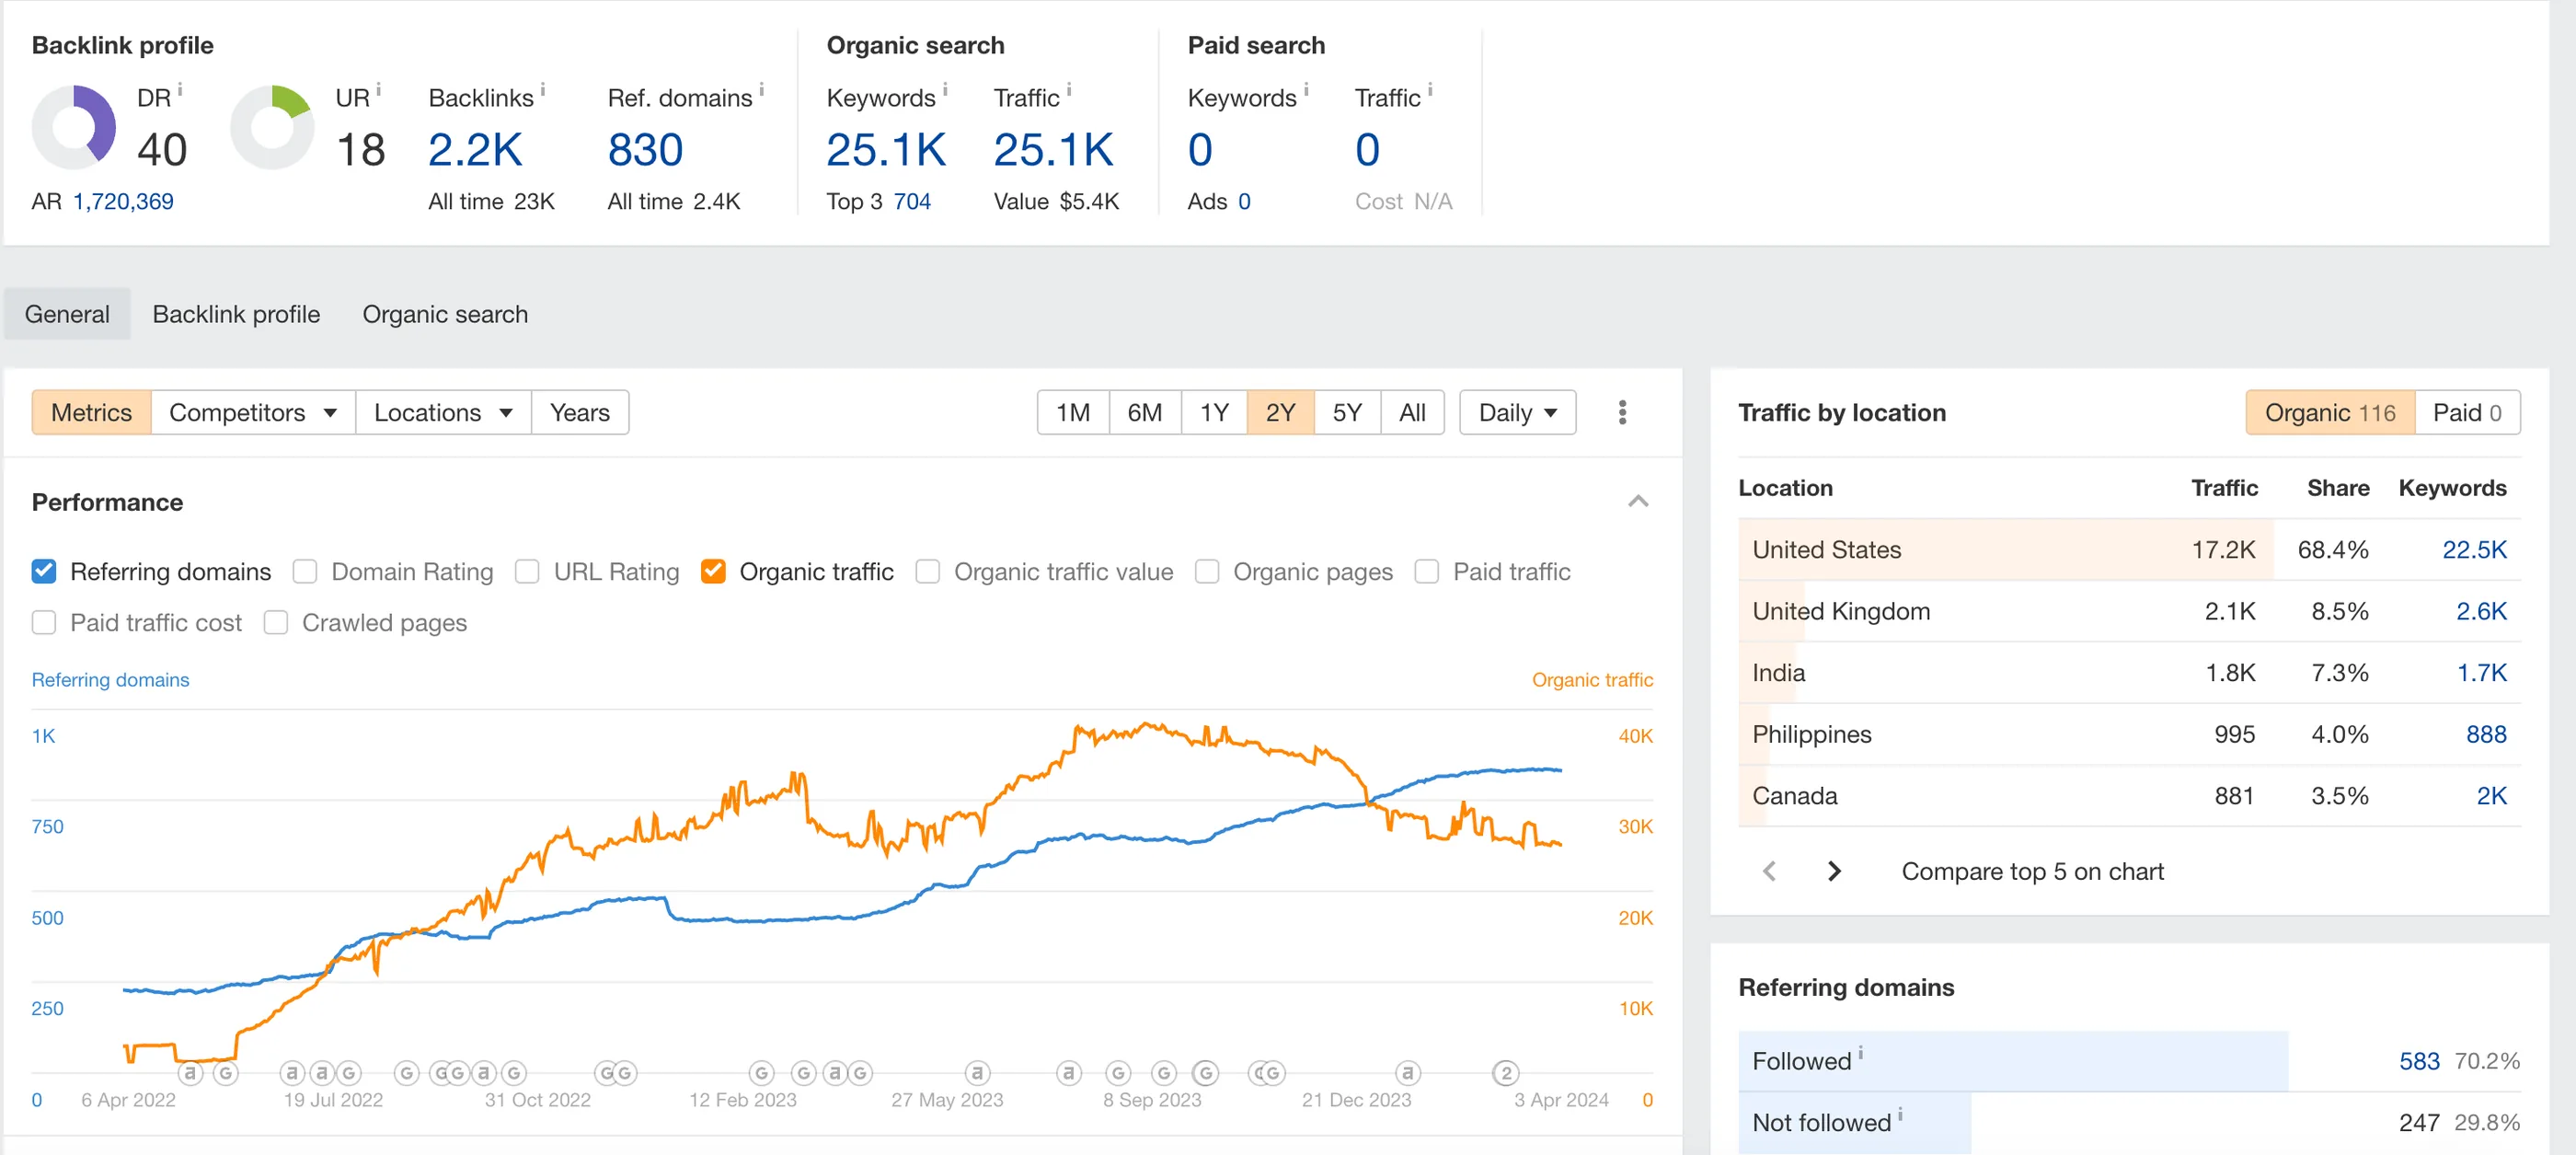
The clinic ranks for 25,100 keywords and Ahrefs estimates 25,100 organic sessions a month from them, with 704 terms holding a top three position. Its 830 referring domains score a Domain Rating of 40, and the traffic is valued at $5,400 a month.
The window is two years to April 2024. Traffic rose from roughly four thousand to a peak near thirty eight thousand in September 2023, and has fallen to around twenty five since.
Why the decline is on the page
Because leaving it off would make the other twelve worth less.
Any provider can show you the eleven that went up. A portfolio with no downward line in it has either been filtered or the provider has never held an account long enough to see one. Both are worth knowing before you sign anything.
What the falling section actually shows is ordinary: rankings that stopped being maintained. Referring domains kept climbing through the decline, which rules out a link problem, and the fall is gradual rather than a cliff, which is not the signature of a manual action or a technical break. It looks like a site that stopped being worked on while its competitors did not.
A keyword count that matches the traffic exactly
Twenty five thousand one hundred keywords. Twenty five thousand one hundred sessions. That ratio, almost exactly one visit per ranking term per month, describes an extremely long tail: thousands of pages each collecting a handful of visits, with very little concentrated in any one of them.
That is a fragile shape. A long tail is cheap to build and cheap to lose, because no single page is load bearing and small ranking slips across thousands of terms add up quietly. It is a different risk profile from the pharmaceutical project here, which holds nearly the same traffic on a fifth of the keywords.
What it does not tell you
Whether the clinic still wanted that traffic. A practice can decide its appointment book is full and stop investing, and the chart would look identical.
It also does not tell you what happened to enquiries, only sessions. Traffic is 68.4% United States, 8.5% United Kingdom and 7.3% India, which for a clinic is an odd mix and suggests a large share of the audience was never going to book anything.
Why this one is on the page at all
For the honest answer to a question every buyer asks and few providers answer: what happens when I stop?
This is what it looks like. Not a collapse, not a penalty, just a slow give back of ground to whoever kept going. It is the argument for the month to month terms on the pricing page being genuinely month to month, and it is also the reason nobody here will tell you the work is ever finished.